Lunar Lake Efficiency is Better Than You Think
Intel recently released its Lunar Lake line of mobile CPU products, which were supposed to have industry leading efficiency. This was to be accomplished through nothing less than a total revolution in Intel’s design philosophy, with three key pillars providing the efficiency improvements:
Outsourcing the manufacture of the parts from Intel’s in house fabs to TSMC, and using their latest and most efficient process family, N3 (specifically N3B)
Reducing the power consumption of the memory bus by exclusively using LPDDR5X memory
A set of design philosophy changes including disabling hyperthreading, lowering core count, lowering clock speed, and significantly widening the E cores
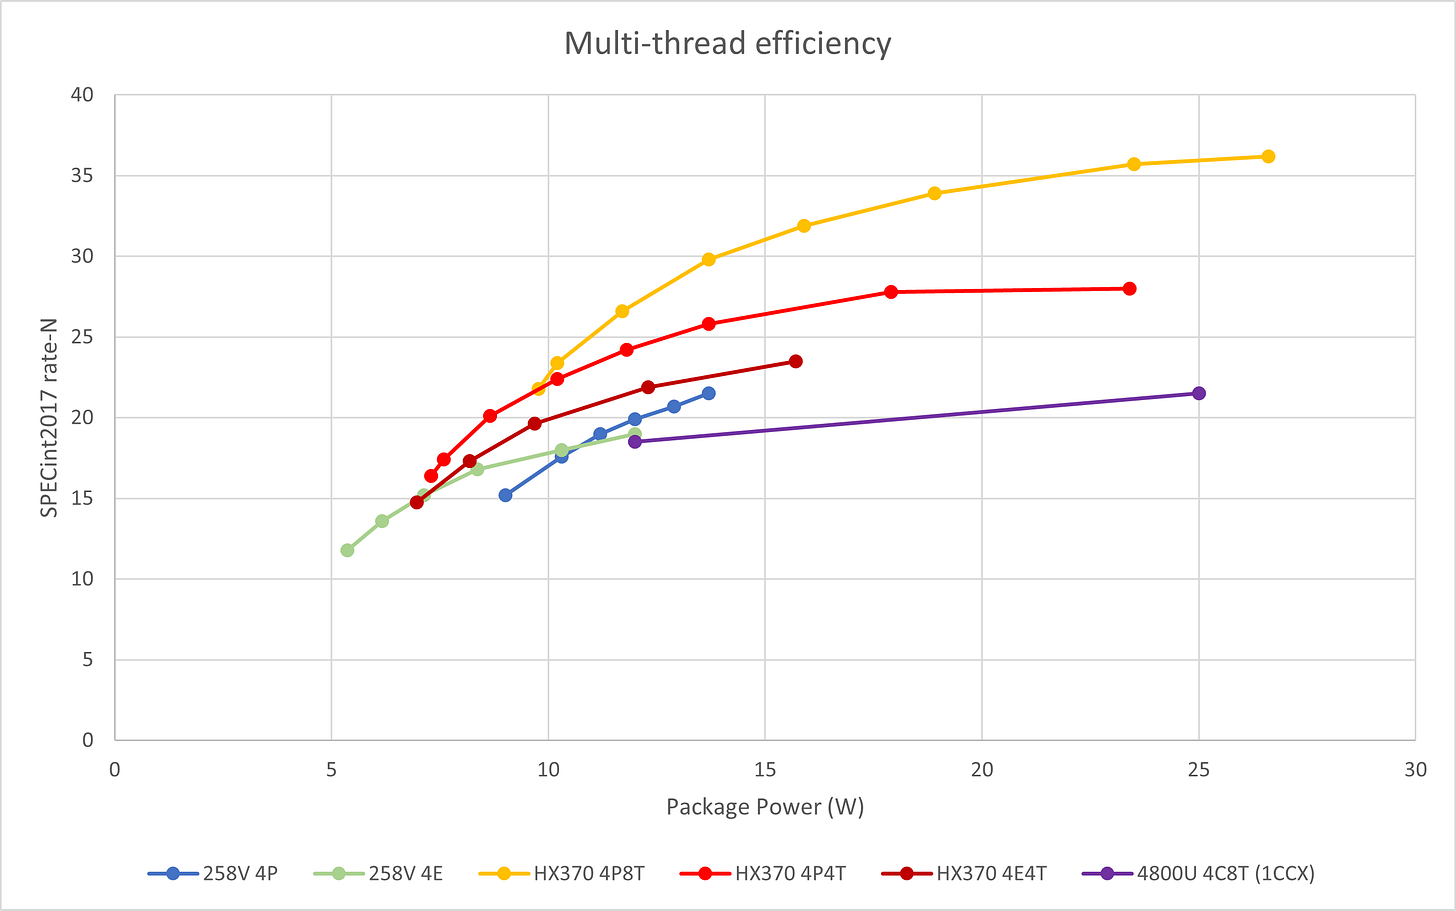
All of this lead to Intel’s most unique processor product launch in many years, perhaps ever. However, some early reports showed that their multi core efficiency, while not bad, did not meet expectations considering the resources brought to bear by Intel. Consumer reviewers like Geekerwan and JustJosh showed that Lunar Lake’s multi core efficiency did not even exceed that of Zen 5 mobile chips, or even Qualcomm’s X Elite processor, at any power level. These products are direct competitors, so not getting the efficiency crown strongly suggests that Intel simply cannot design an efficient CPU.
And another example here, showing quite poor power efficiency:
(Note: For those unaware, the 258V is Lunar Lake)
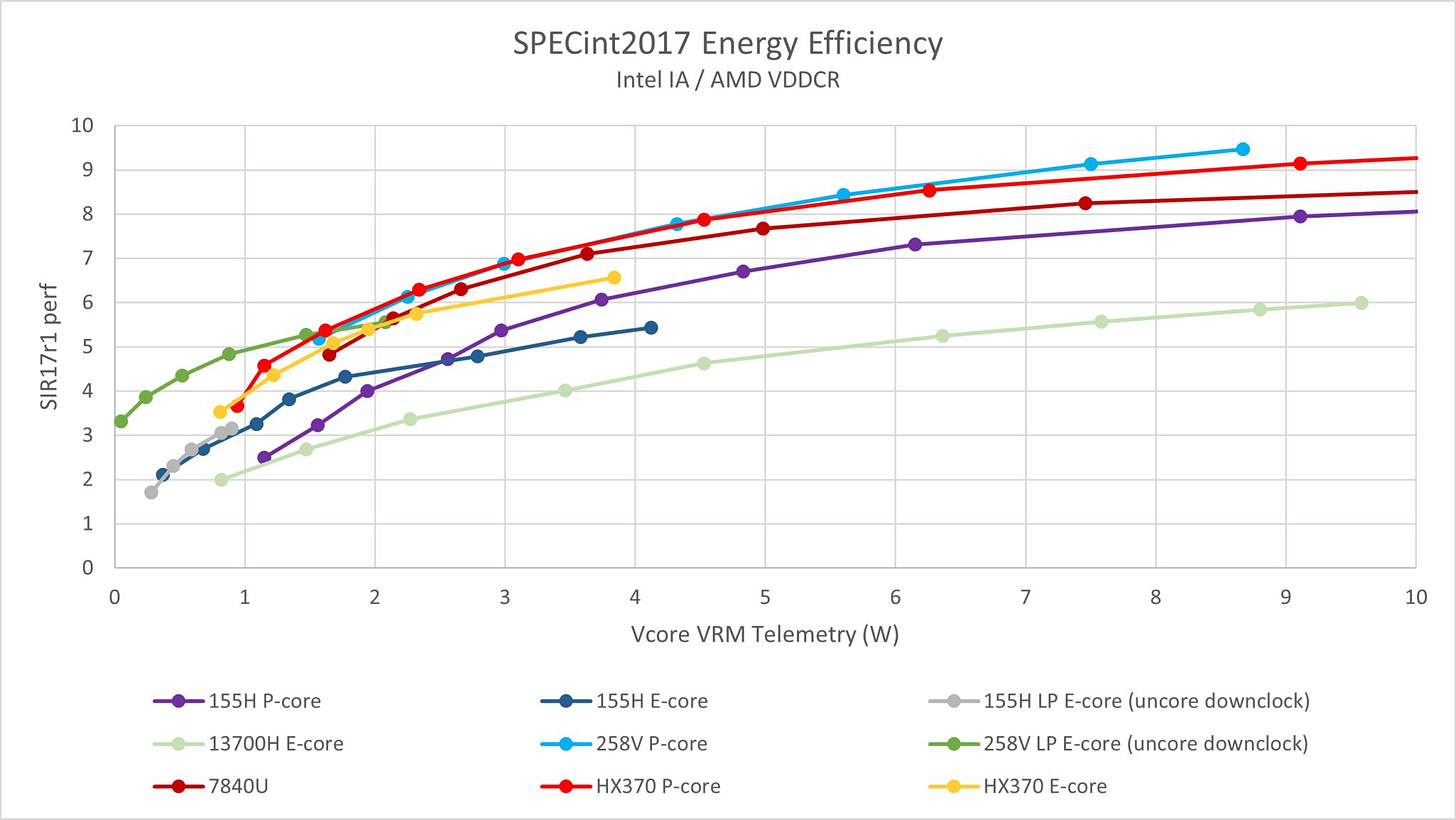
But, things get stranger when looking at single core performance only. From this perspective, Intel does show class leading efficiency, especially on their newly widened Skymont E cores.
So, what’s going on here? I think I have an answer, and I believe it has to do with the fact that no company has yet launched a new product with less cores than its prior generation.
The Explanation
As everyone knows at this point, CPU cores have an optimal power band where they operate most efficiently. Below a certain power level, the core will barely do any work and just passively consume power due to being powered on. Above a certain power level, increases in frequency diminish rapidly and pumping more power in does not improve performance.
Below shows such an efficiency curve with fake data. As you can see, on this fake CPU, the peak efficiency band is around 0.75 watts, with efficiency decreasing continuously beyond that power level.
So, with this efficiency curve in mind, we have everything we need to explain why Lunar Lake’s multicore efficiency disappoints despite its class leading single core efficiency.
Imagine we have three CPUs, 4C, 8C, and 12C, with 4, 8, and 12 cores respectively. These CPUs have identical core architecture, their only difference is the core count. Let’s say each core has the efficiency curve shown above. Now let’s compute the efficiency curve on the range [5, 35] watts, where we distribute that wattage equally (!) among the N cores.
Wait, what’s going on? If all the cores on this CPU have the same efficiency curve, why are the perf / watt curves so different? Well, the answer, if it isn’t obvious yet, is that adding more cores pushes down each individual cores’ wattage, which moves it closer to the optimal efficiency power band.
This explains why Lunar Lake multi core efficiency is worse than expected. More cores gives more efficiency, even with the same core design, and Lunar Lake has less cores, not more. This is a major downside of Intel’s decision to reduce core count on a high efficiency part.
IS WHAT I WOULD HAVE SAID
Above is what I WOULD have said, if I hadn’t realized right before publishing that this chart by David Huang actually did test the other CPUs with the same number of cores enabled. The HX370 here has 4 cores only enabled, yet still shows much better efficiency, which is completely at odds with what the single core results indicate.
Is something deeply wrong with Lunar Lake then? David Huang himself also seems to think so, as he mentioned possible BIOS issues in his blog post. Anyways, I still think this article is interesting enough to publish, and has some nice theory charts, so here it is.


